Analytics
Analytics shows conversation activity, credit usage, channel performance, safety signals, and voice activity for the selected AI agent and time range.
Accessing Analytics
- In the left sidebar, select the AI agent you want to review.
- Open Analytics under that agent.
Analytics is available on plans that include basic analytics.
Filters
Use the filters at the top of the page to control what the dashboard shows:
- Date range — choose Today, Yesterday, This Week, Last Week, This Month, Last Month, Last 6 Months, Last 12 Months, or select a custom range.
- Channel — filter the dashboard by channel. Conversation analytics supports Widget, WhatsApp, Facebook, Instagram, Viber, and Telegram. The Credits tab can also include Outlook and Zendesk credit activity.
Changing the date range or channel refreshes the charts and metric cards for the selected agent.
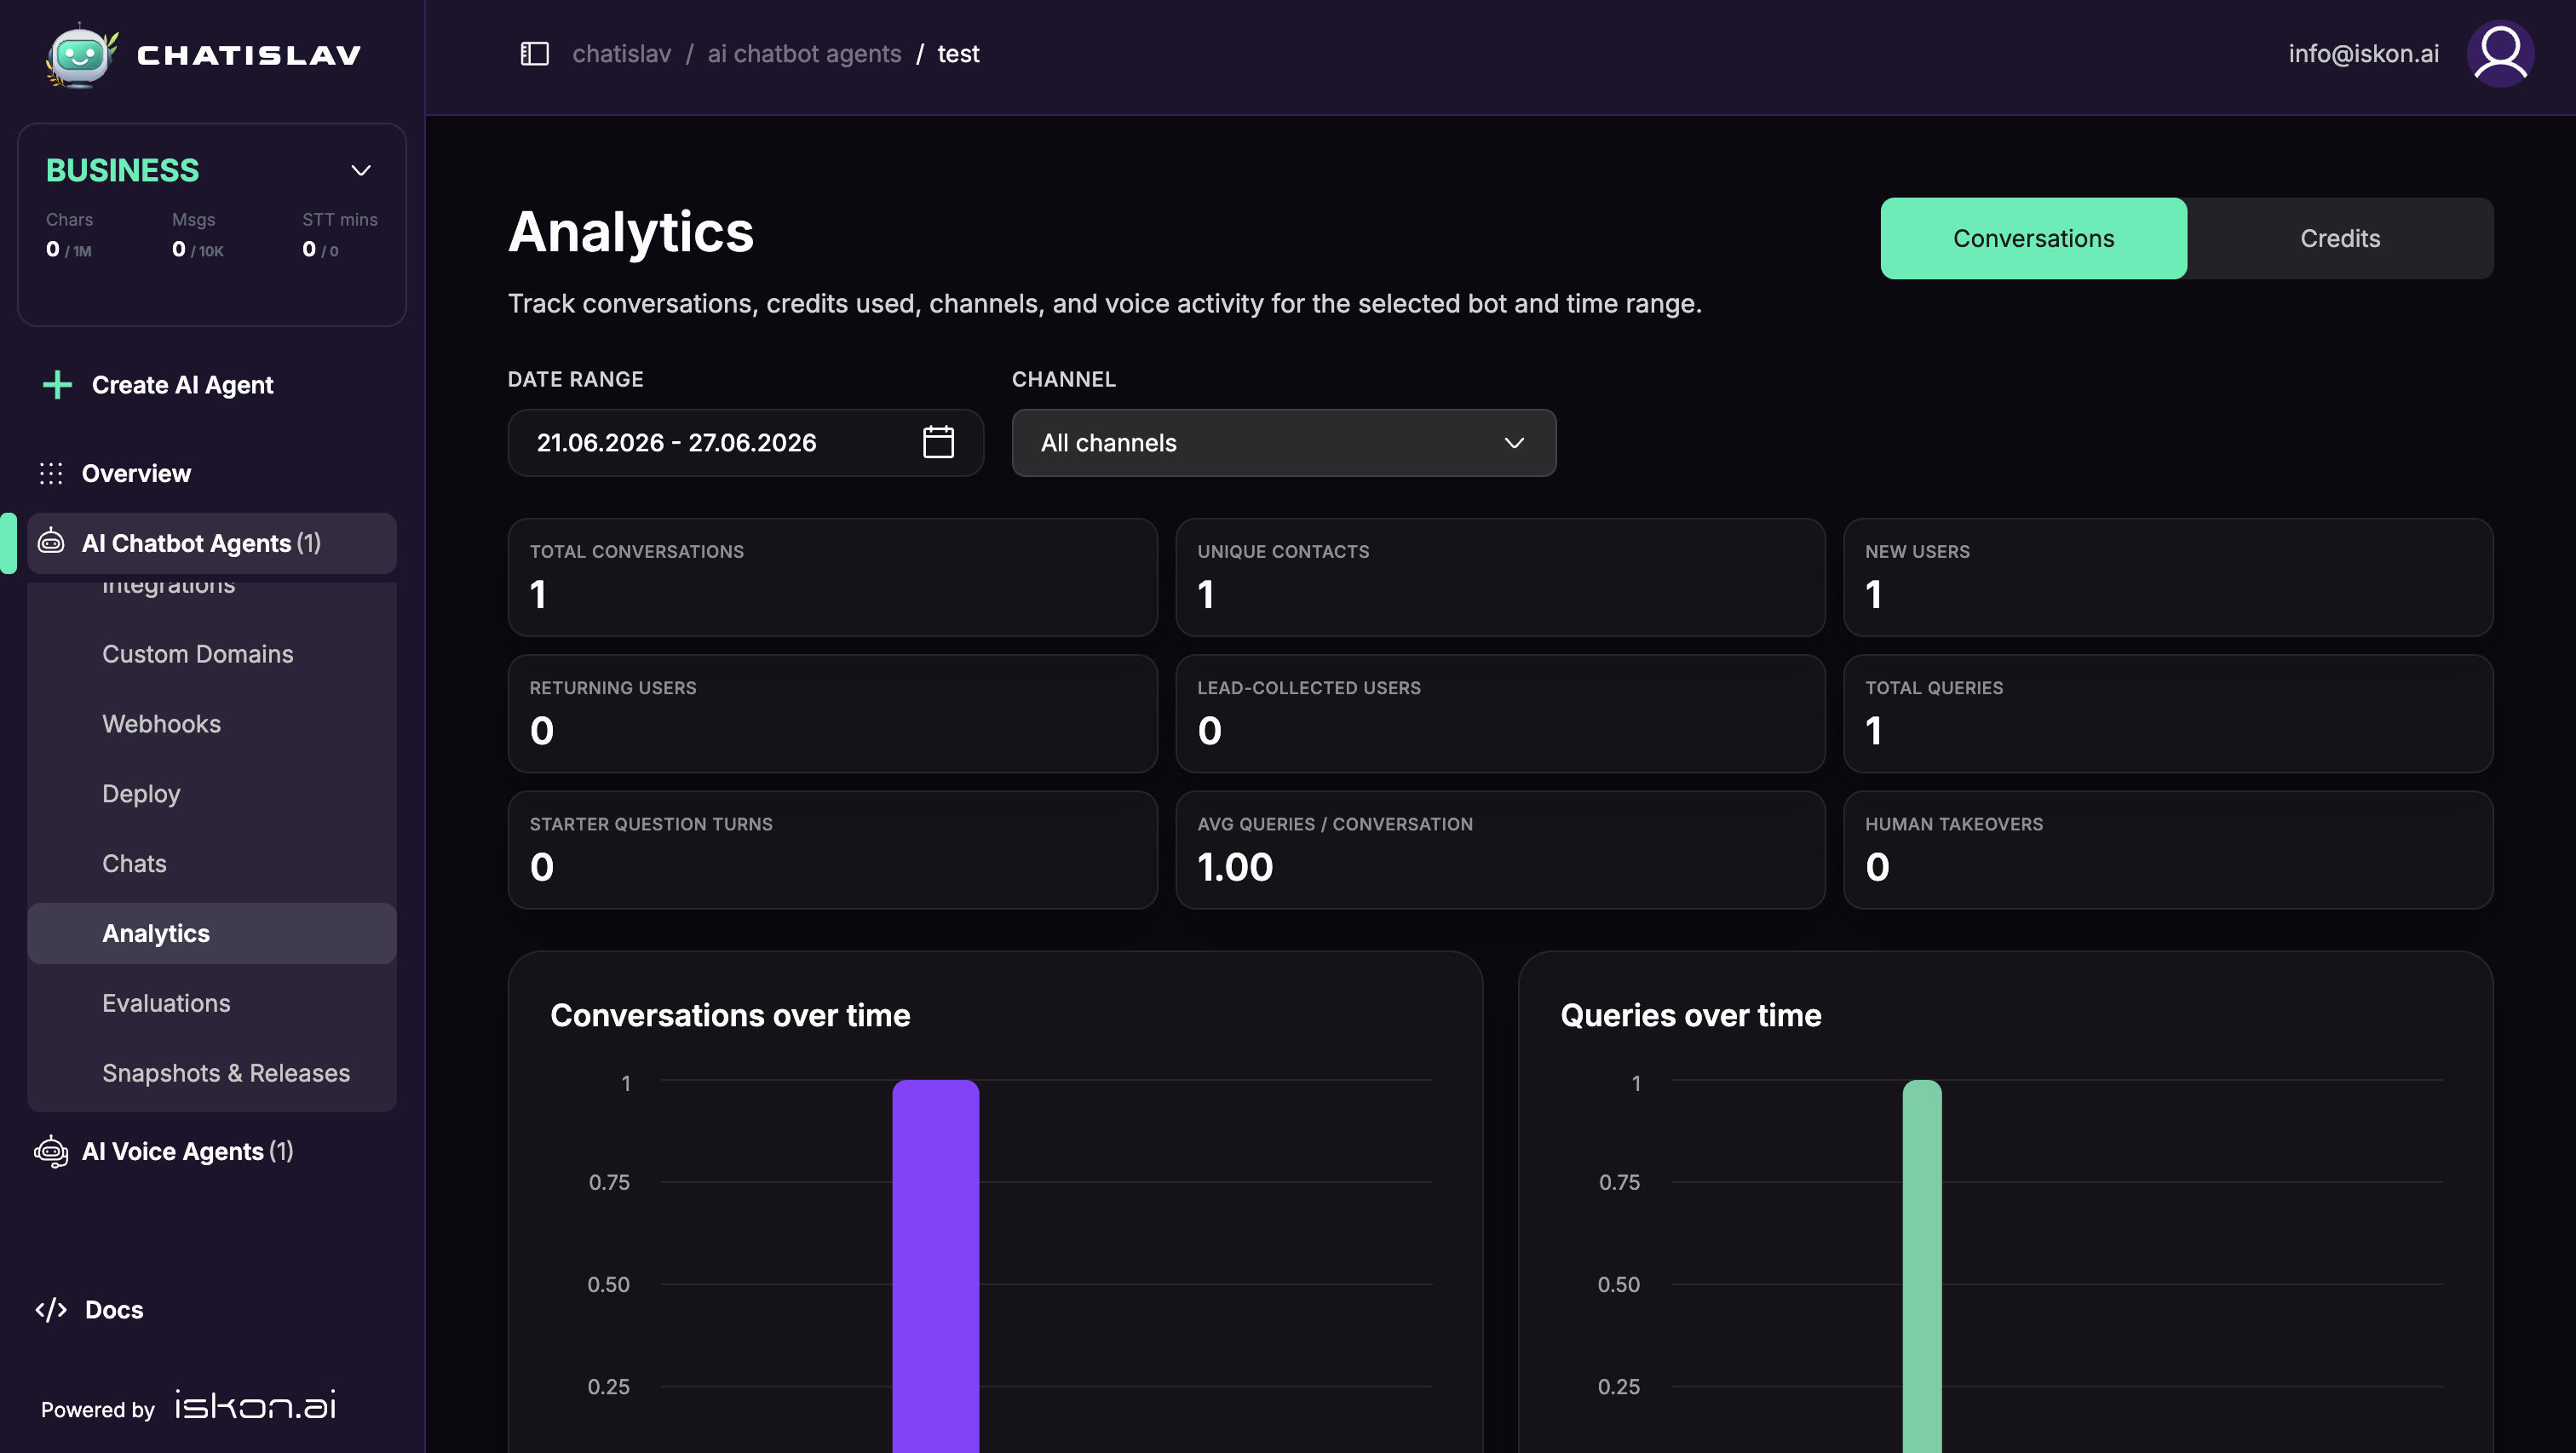
Conversations Tab
The Conversations tab tracks how users are interacting with the agent.
Summary Cards
Use the top cards to review:
- Total conversations — conversations started in the selected period.
- Unique contacts — distinct users or channel contacts that interacted with the agent.
- New users and Returning users — new contacts versus contacts who were already known before the selected range.
- Lead-collected users — users with collected lead data.
- Total queries — user messages/questions counted for the selected period.
- Starter question turns — user turns that came from starter questions.
- Average queries per conversation — average query volume per conversation.
- Human takeovers — conversations marked for human takeover in the selected period.
Charts and Breakdowns
The Conversations tab includes:
- Conversations over time — conversation volume by day.
- Queries over time — user query volume by day.
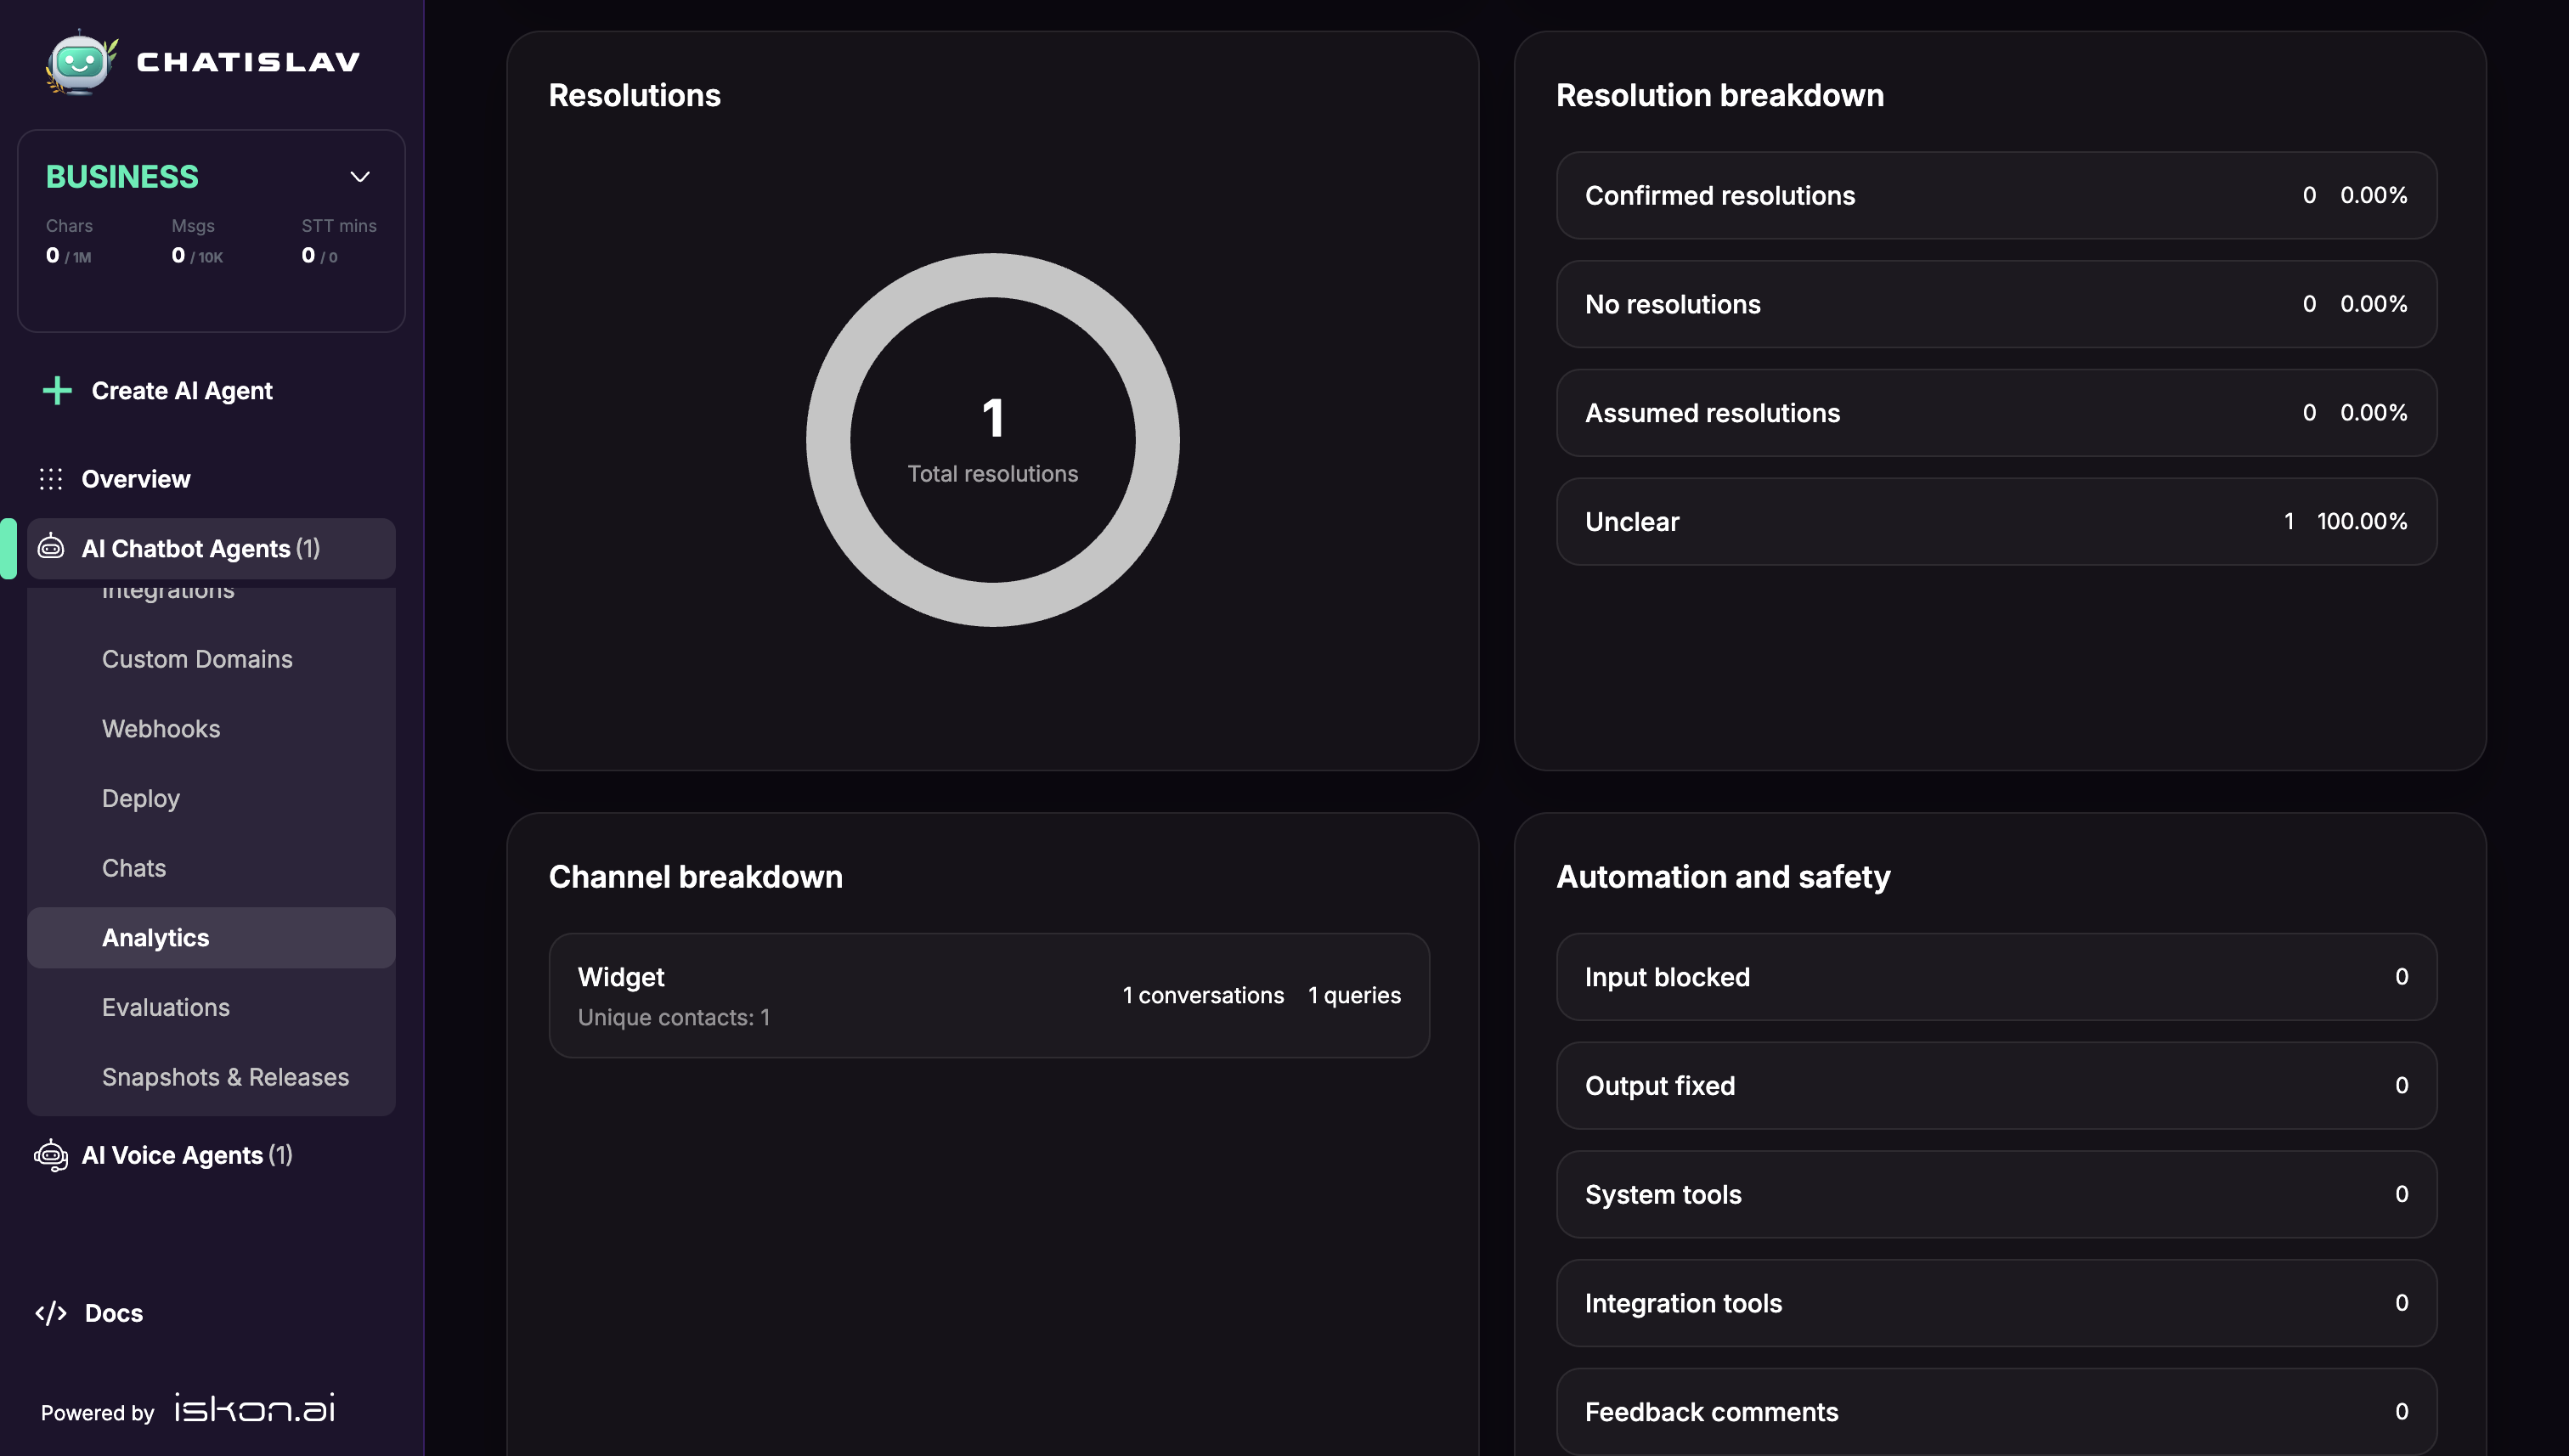
- Resolution breakdown — confirmed resolutions, assumed resolutions, no resolutions, and unclear outcomes.
- Channel breakdown — conversations, queries, and unique contacts by channel.
- Automation and safety — guardrail input/output events, system or integration tool usage, and feedback comments.
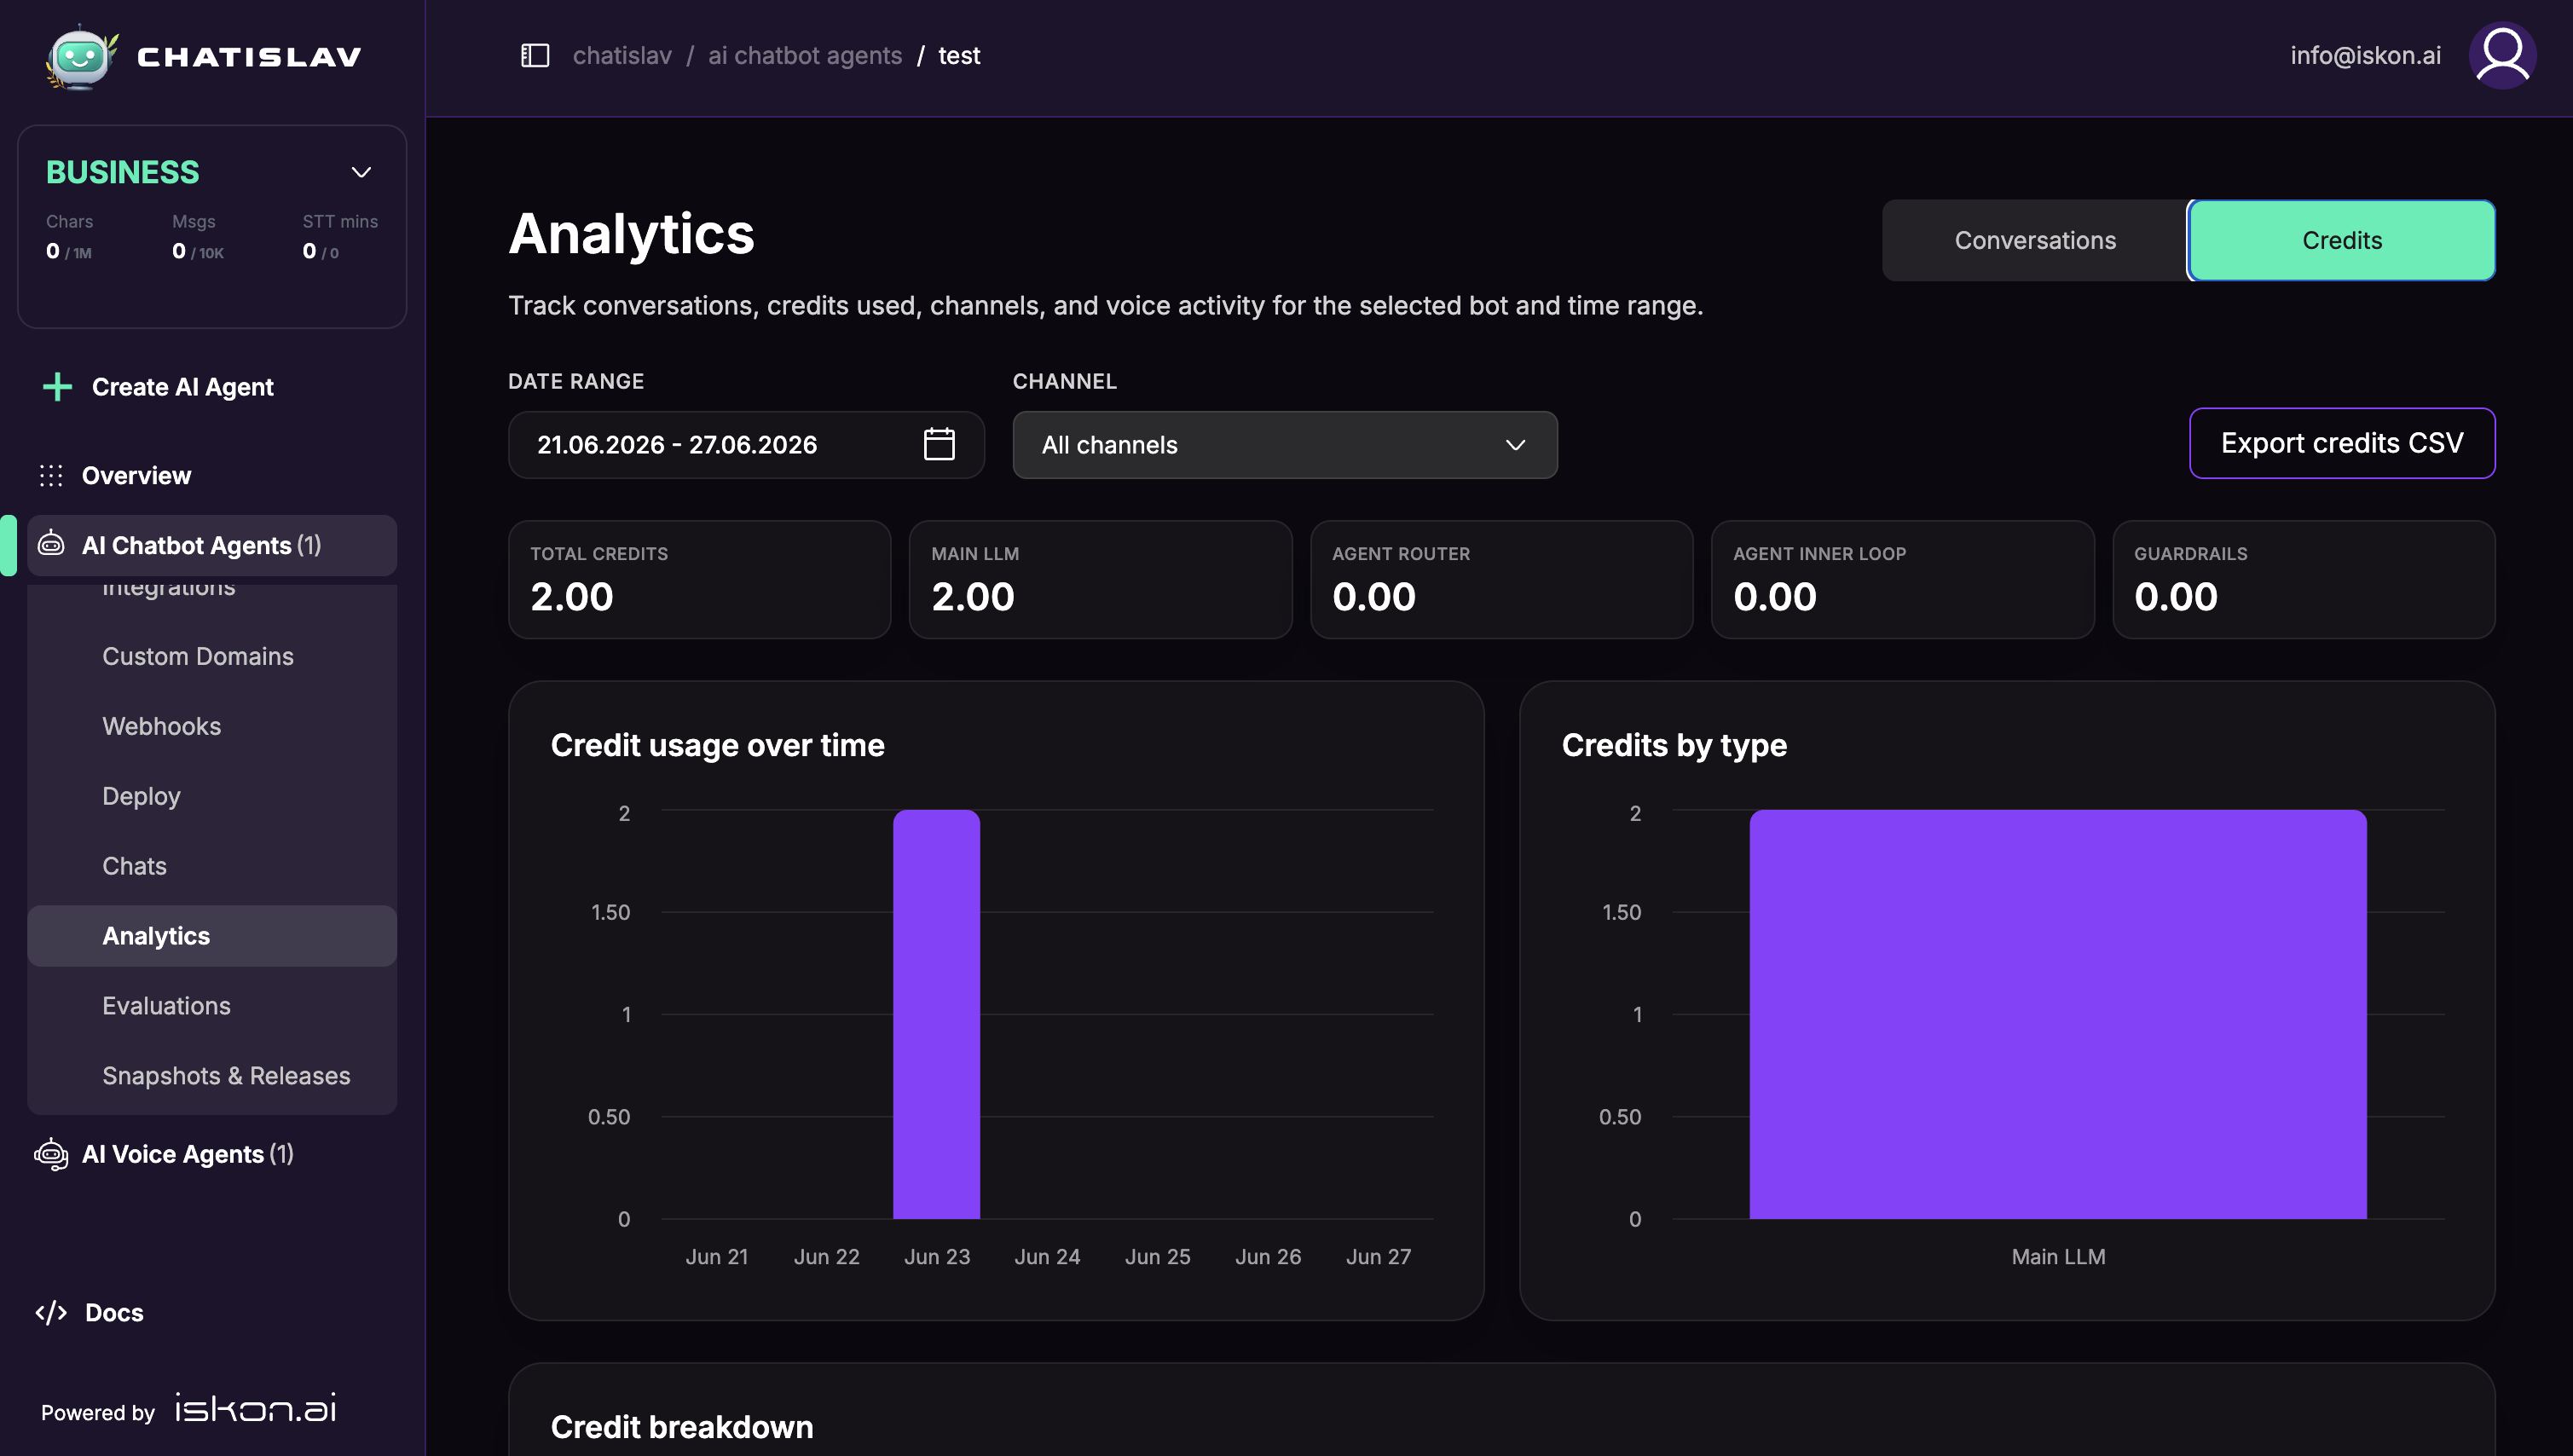
Credits Tab
The Credits tab shows how many credits the selected agent used during the selected period.
Use this tab to review:
- Total credits used in the selected period.
- Credit usage from Main LLM, Agent router, Agent inner loop, and Guardrails.
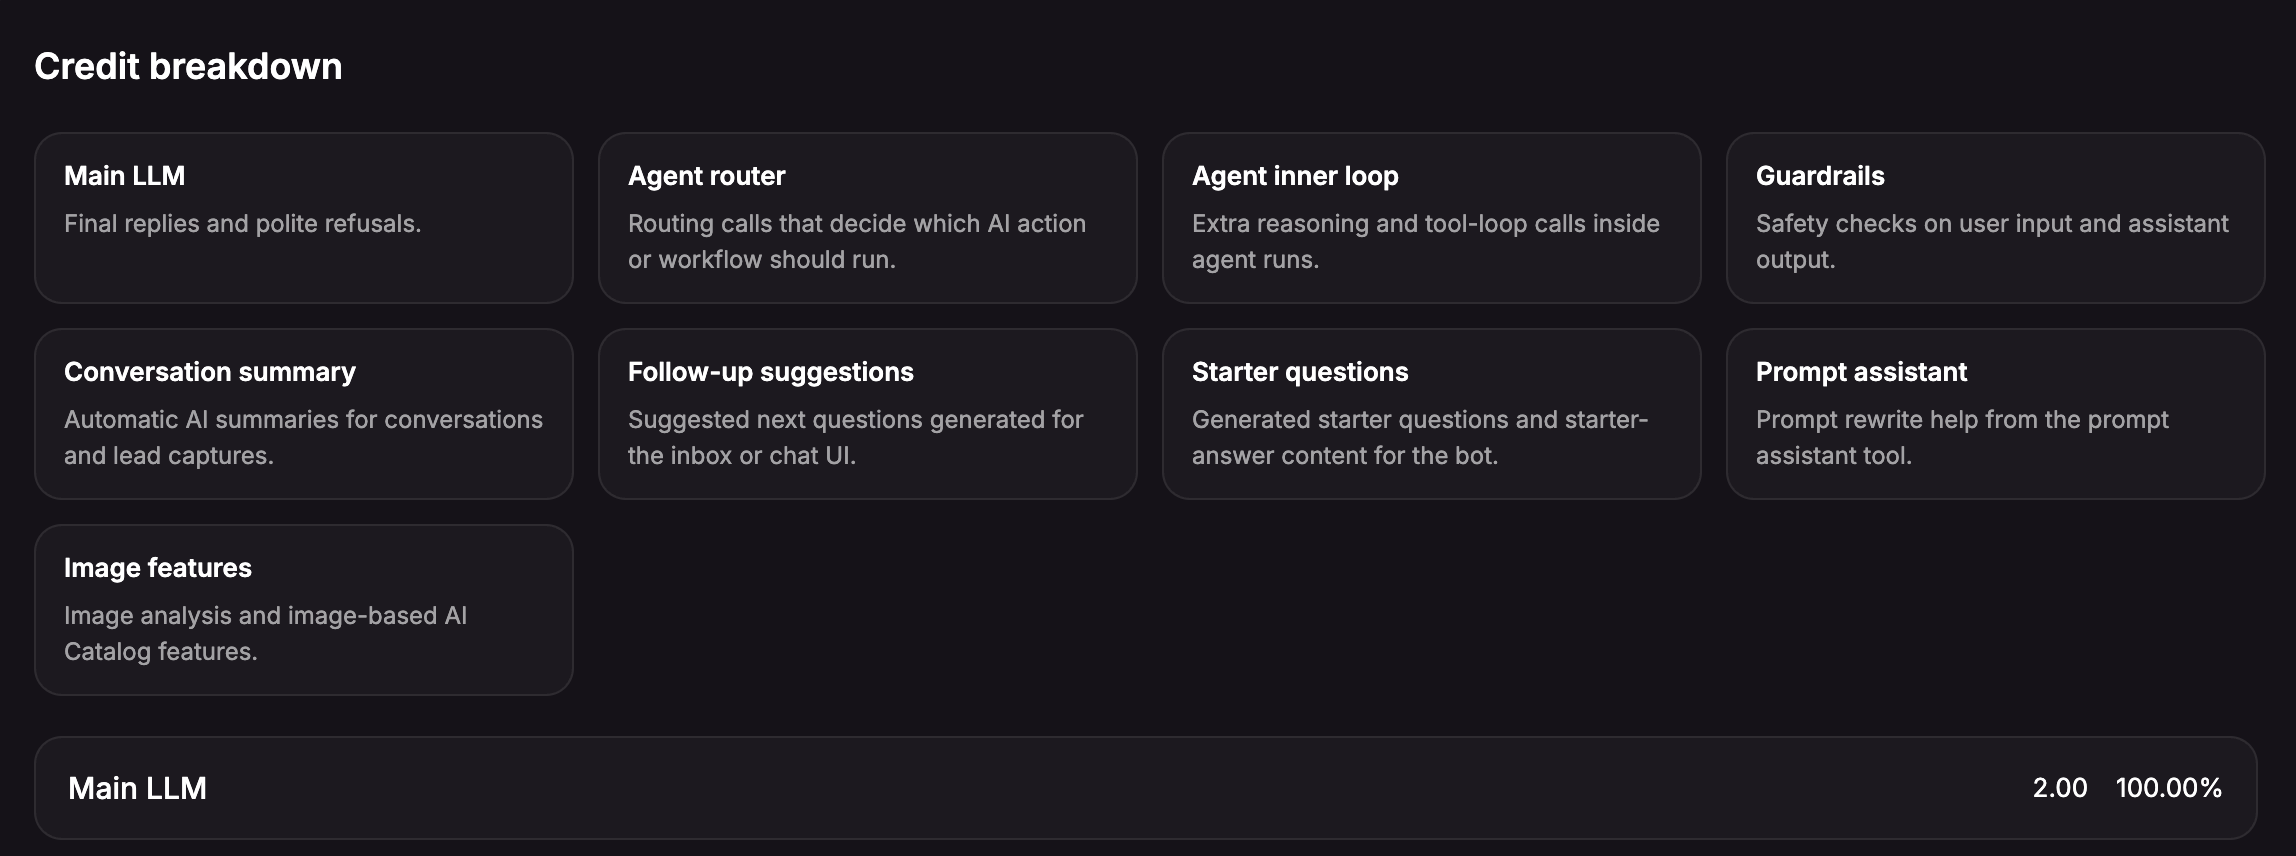
- Additional credit categories when they were used, such as conversation summaries, follow-up suggestions, starter questions, prompt assistant, image features, or other credited work.
- Credit usage over time and Credits by type charts.
- Export credits CSV to download the credit summary, daily timeseries, and breakdown.
The Credit breakdown section explains each credit category and shows its credit count and share of total usage.
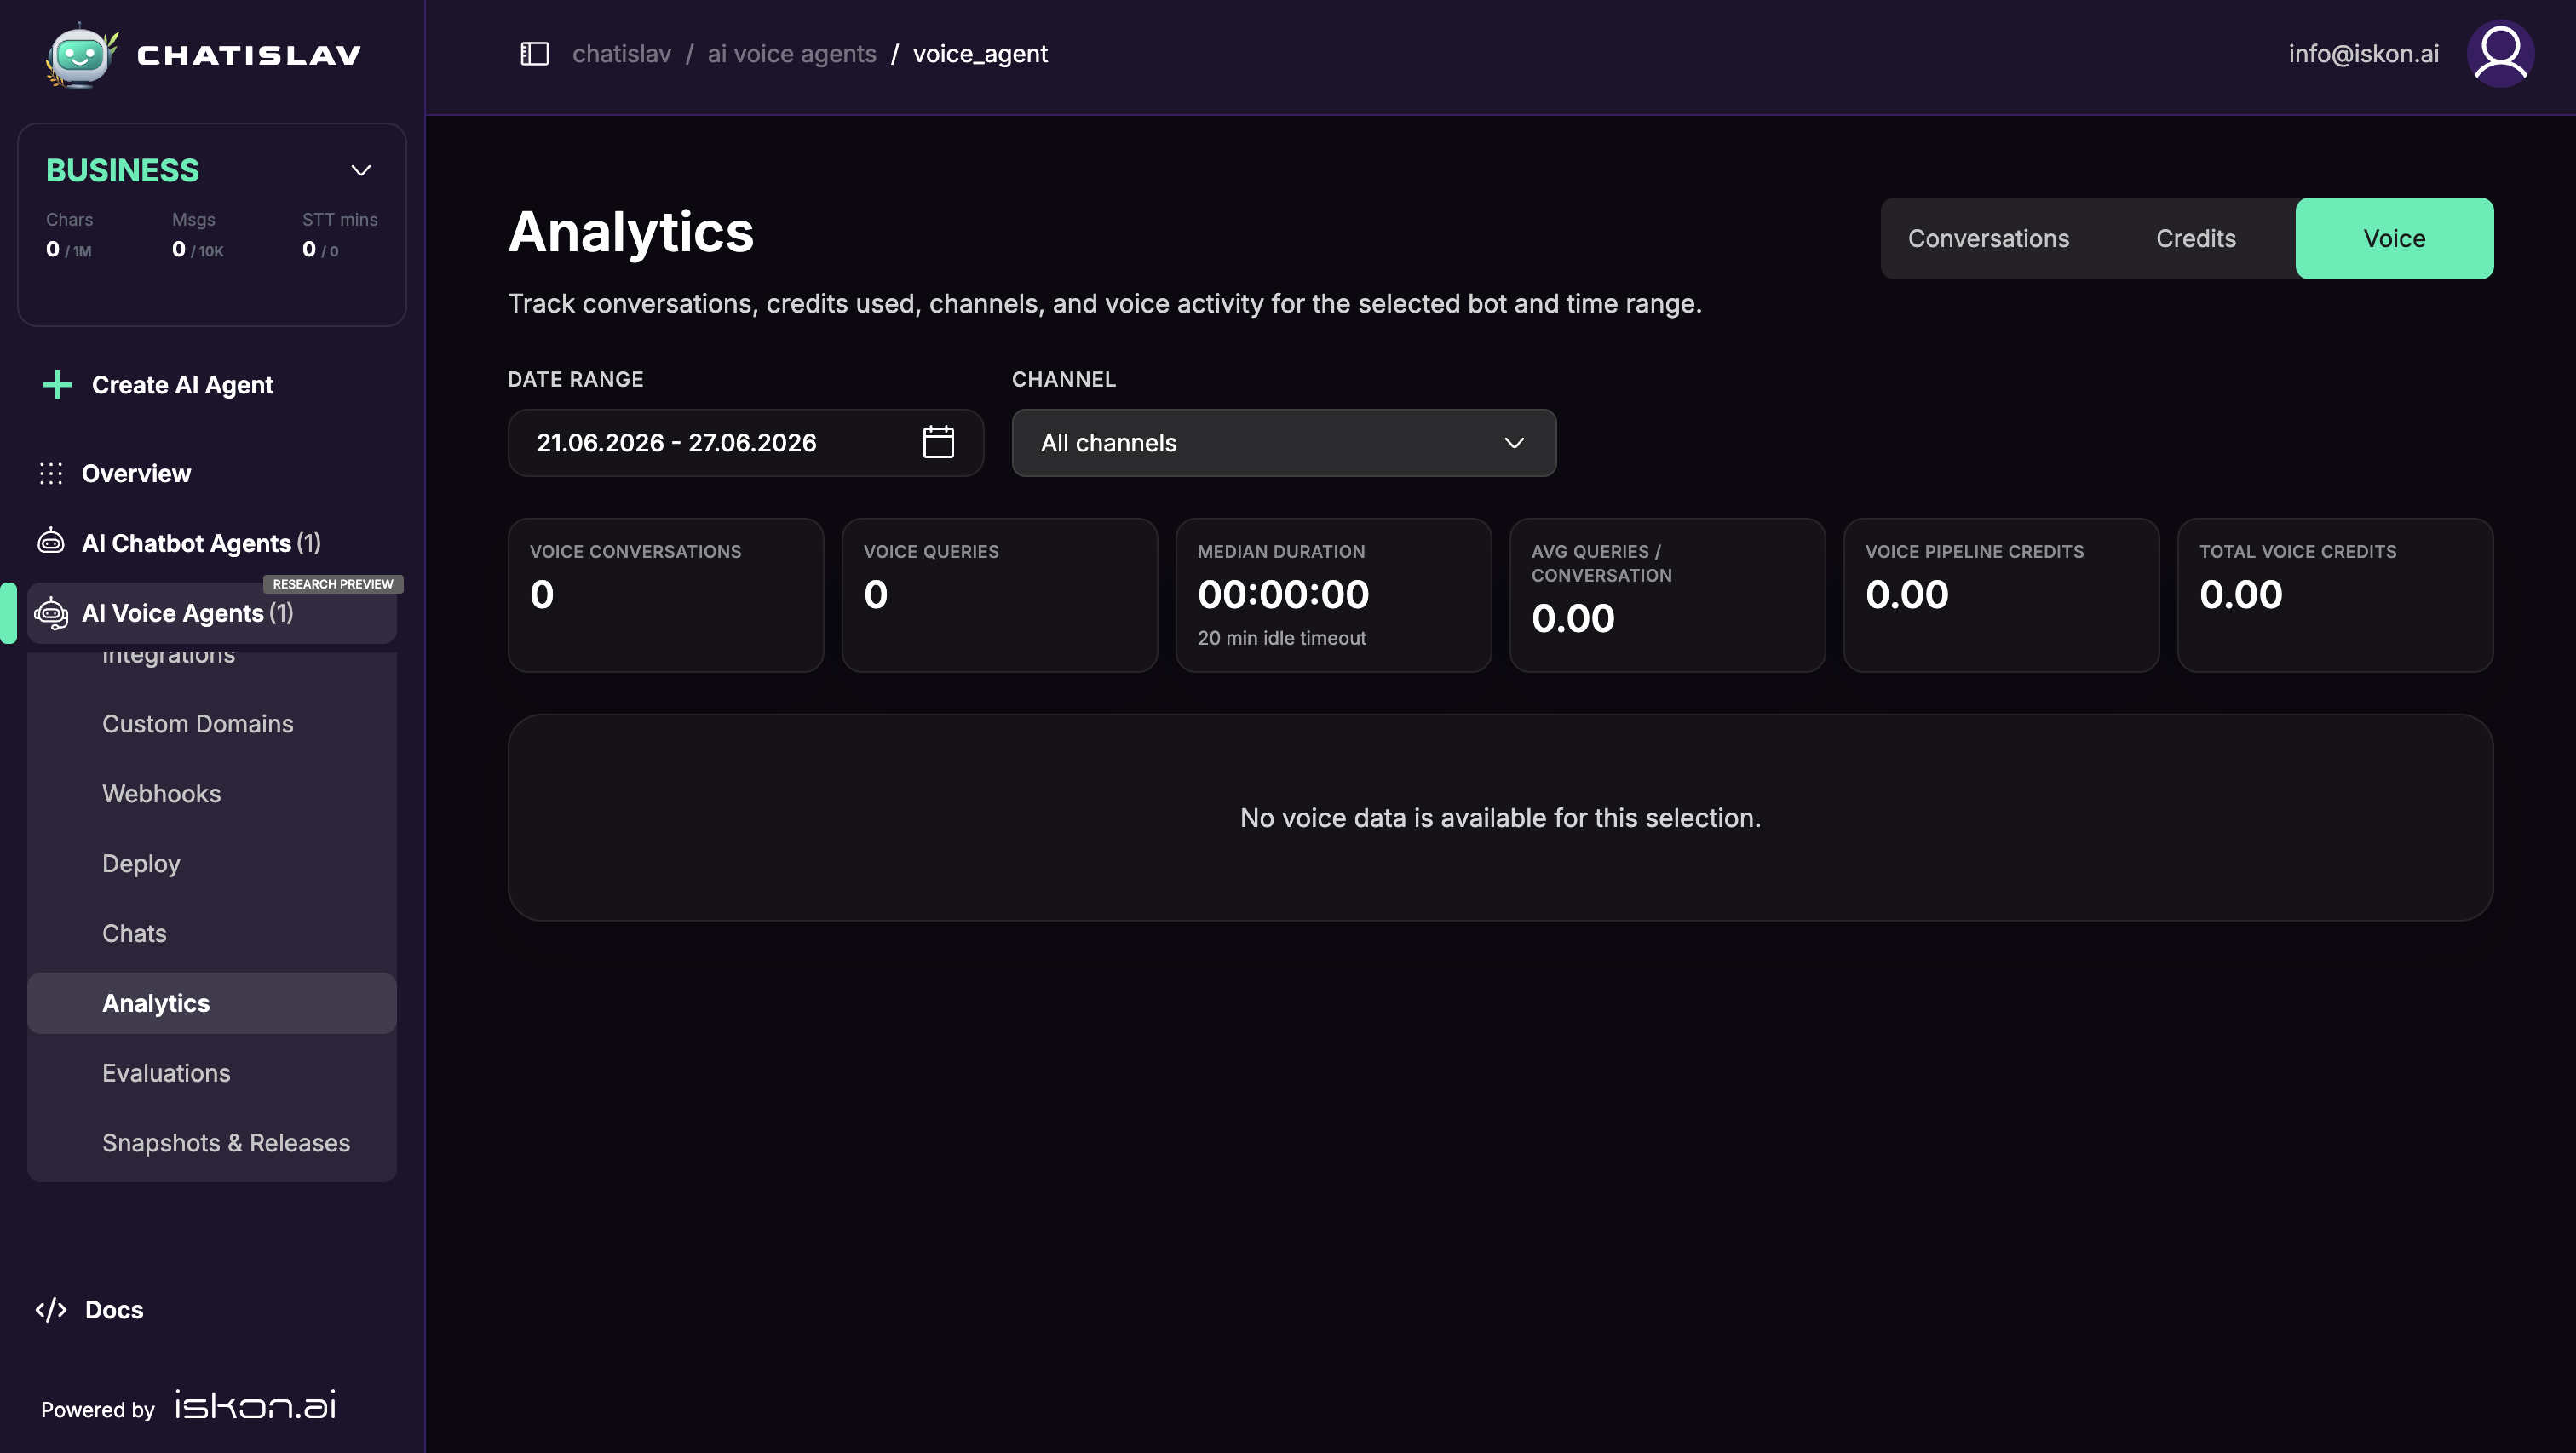
Voice Tab
For voice agents, Analytics also shows a Voice tab.
Use the Voice tab to review:
- Voice conversations and Voice queries.
- Median duration with a 20-minute idle timeout note.
- Average queries per conversation.
- Voice pipeline credits and Total voice credits.
- Voice activity and voice credit trends over time.
- Channel breakdown for voice conversations.
Best Practices
- Start with Conversations to see whether users are engaging and whether issues are being resolved.
- Use Channel filtering to compare performance across Widget, WhatsApp, Facebook, Instagram, Viber, Telegram, and credit-only channels where available.
- Check Automation and safety when guardrail events or tool usage increase.
- Use the Credits tab when investigating usage changes or preparing a billing/usage review.